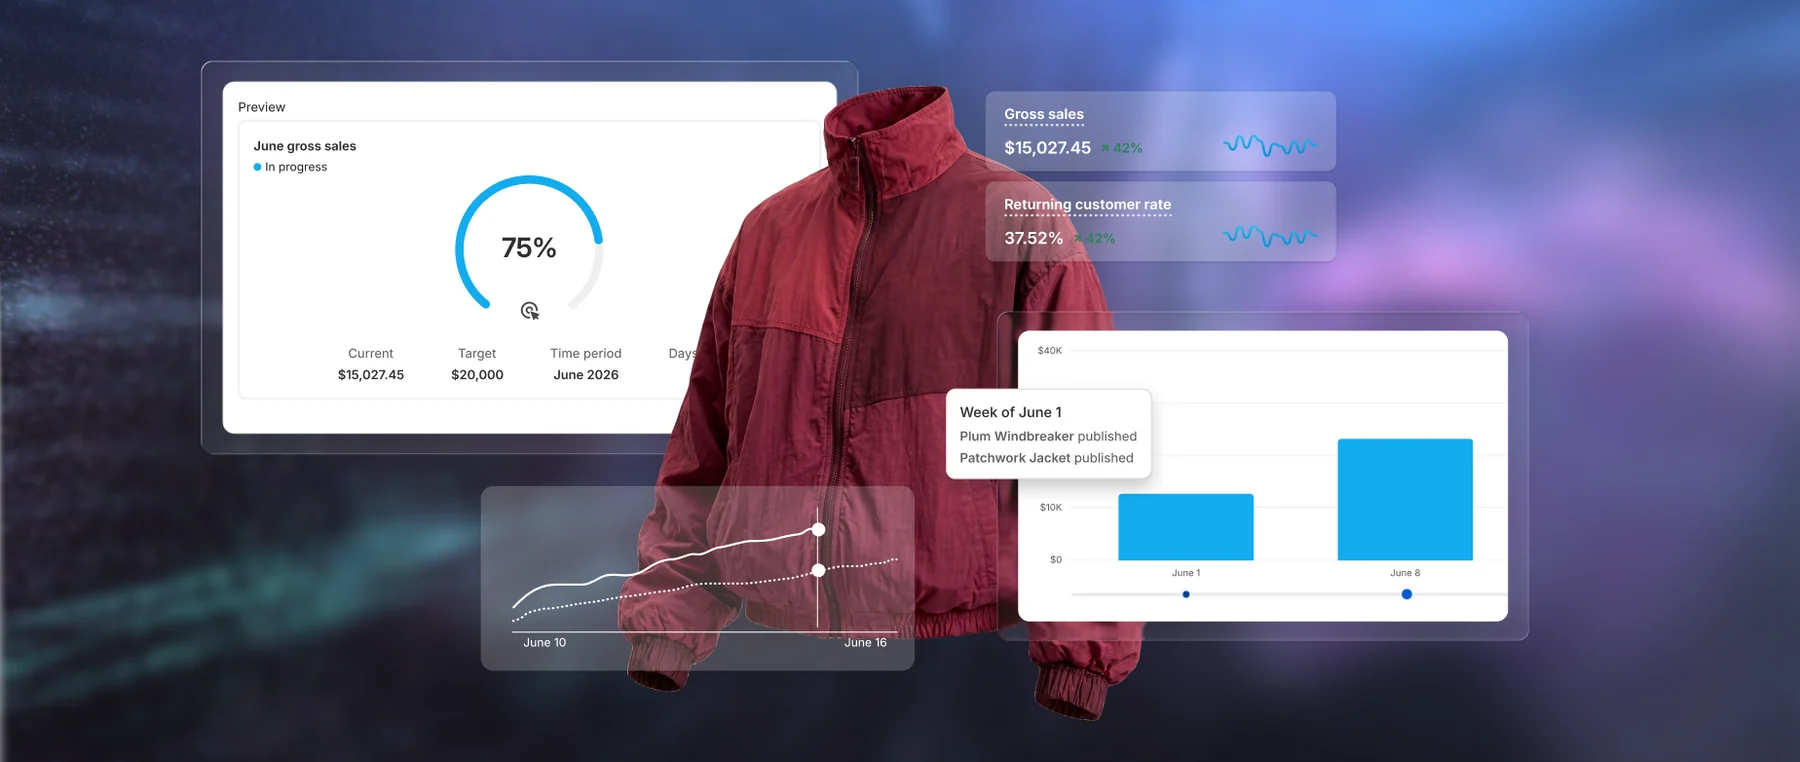
Reporting and analytics become more valuable when merchants understand how to read store data, ask better business questions, and use reports to make decisions.
The following official Shopify resources are helpful for learning more about ecommerce reporting, analytics, dashboards, data visualization, and store performance analysis.
These articles are useful for merchants who want to better understand how store data can support sales, operations, finance, marketing, inventory planning, customer retention, and business growth.
This Shopify article explains how ecommerce reporting helps merchants turn raw store data into structured reports that support business decisions. It covers important report categories such as sales and revenue, customer reports, marketing and acquisition, product and inventory, and returns and post-purchase reporting.
The article is especially useful because it explains which metrics merchants should track, why those metrics matter, and how often different reports should be reviewed.
Why this is recommended
This article is useful for understanding how different reports support different operating rhythms.
For example:
- Sales and revenue reports can be reviewed daily or weekly.
- Customer reports help merchants understand retention and customer value.
- Product and inventory reports help identify stock risk, slow-moving items, and catalog performance.
- Returns and refund reports help uncover product, content, quality, or customer experience issues.
This connects closely with ReportWisp because ReportWisp helps merchants review these reporting areas in a more structured way across orders, products, customers, inventory, refunds, channels, and financial activity.
Shopify Reports and Analytics: Beginner’s Guide
This Shopify guide explains what Shopify reports and analytics show, where merchants can find reports in Shopify admin, and how reports can be used to understand store performance.
It also explains the difference between reporting and analysis: reporting shows what happened, while analysis helps merchants understand why it happened and what to do next.
Why this is recommended
This article is useful for merchants who are new to store reporting and want to understand how analytics should be used in daily decision-making.
It encourages merchants to ask better questions before reviewing data, such as:
- What changed?
- Why did it change?
- Which source, product, customer group, or campaign caused the change?
- What decision should be made from this data?
This aligns well with ReportWisp’s purpose: helping merchants move from raw store data to clear reports, deeper visibility, and faster business decisions.
Better Context for Your Store’s Data: 5 Updates to Analytics in Shopify
This Shopify article highlights newer analytics updates designed to give merchants better context around store data. It explains how analytics can help merchants understand what changed, why it changed, and how store teams can use data in workflows and automations.
The article also discusses using analytics data through Shopify Flow, including scheduled checks and actions based on reporting data.
Why this is recommended
This article is useful because it supports the idea that reporting should not stop at viewing numbers.
Good analytics should help merchants:
- Understand the context behind performance changes
- Review store trends more clearly
- Use data inside operating workflows
- Take action based on measurable business activity
- Make reporting part of ongoing store management
This is closely related to ReportWisp’s value because ReportWisp is designed to help merchants use store reports as decision-support tools, not just static data tables.
New Ways To See Your Data in Shopify’s Analytics
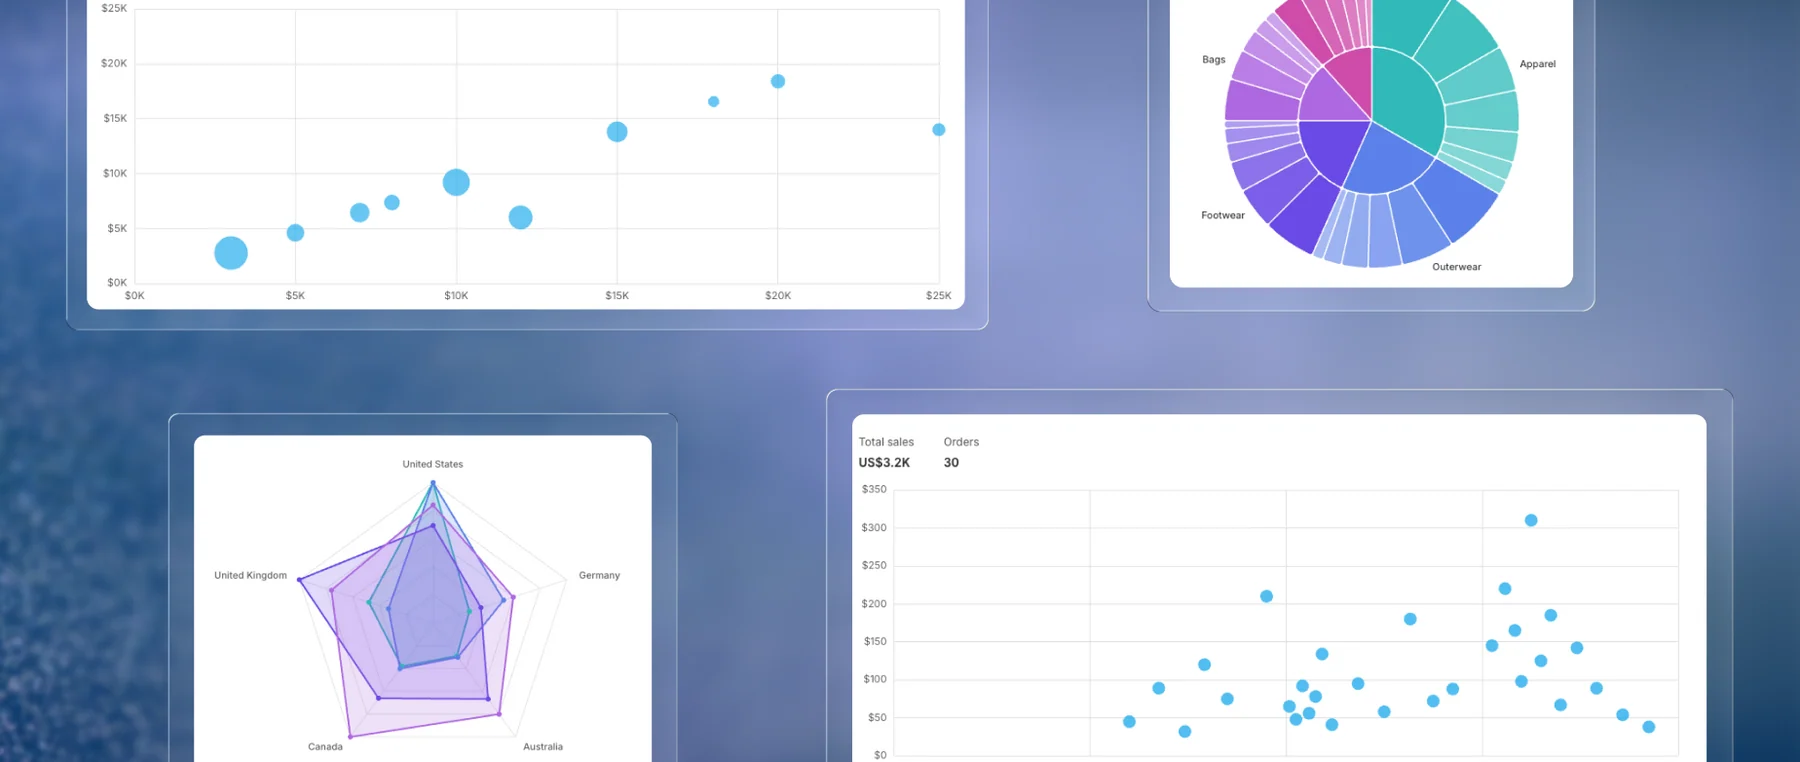
This Shopify article explains the importance of data visualization in analytics. It introduces visualization formats such as scatter plots, bubble charts, radar charts, sunburst charts, and multi-metric chart support.
The article shows how different visualizations can help merchants compare metrics, identify relationships, understand patterns, and explore business performance from different angles.
Why this is recommended
This article is useful for understanding why visualization matters in ecommerce analytics.
Raw data can be difficult to interpret. Visual reports help merchants quickly see:
- Trends over time
- Relationships between metrics
- Product or channel comparisons
- Performance outliers
- Business patterns that may be missed in tables
This connects strongly with ReportWisp because ReportWisp uses dashboards, KPI cards, charts, tables, and structured views to help merchants understand store performance faster.
How These Articles Help You Use ReportWisp Better
These Shopify resources explain the broader value of ecommerce reporting and analytics.
Together, they help merchants understand that reports are not just for looking at numbers. Reports should help answer business questions, such as:
- What happened in the store?
- Why did it happen?
- Which products, customers, channels, or operations contributed to the change?
- What needs attention?
- What action should the team take next?
ReportWisp is built around this same idea.
By combining structured reports, dashboards, filters, visualizations, exports, schedules, and store performance insights, ReportWisp helps merchants use reporting as part of daily operations, weekly reviews, monthly planning, and long-term decision-making.